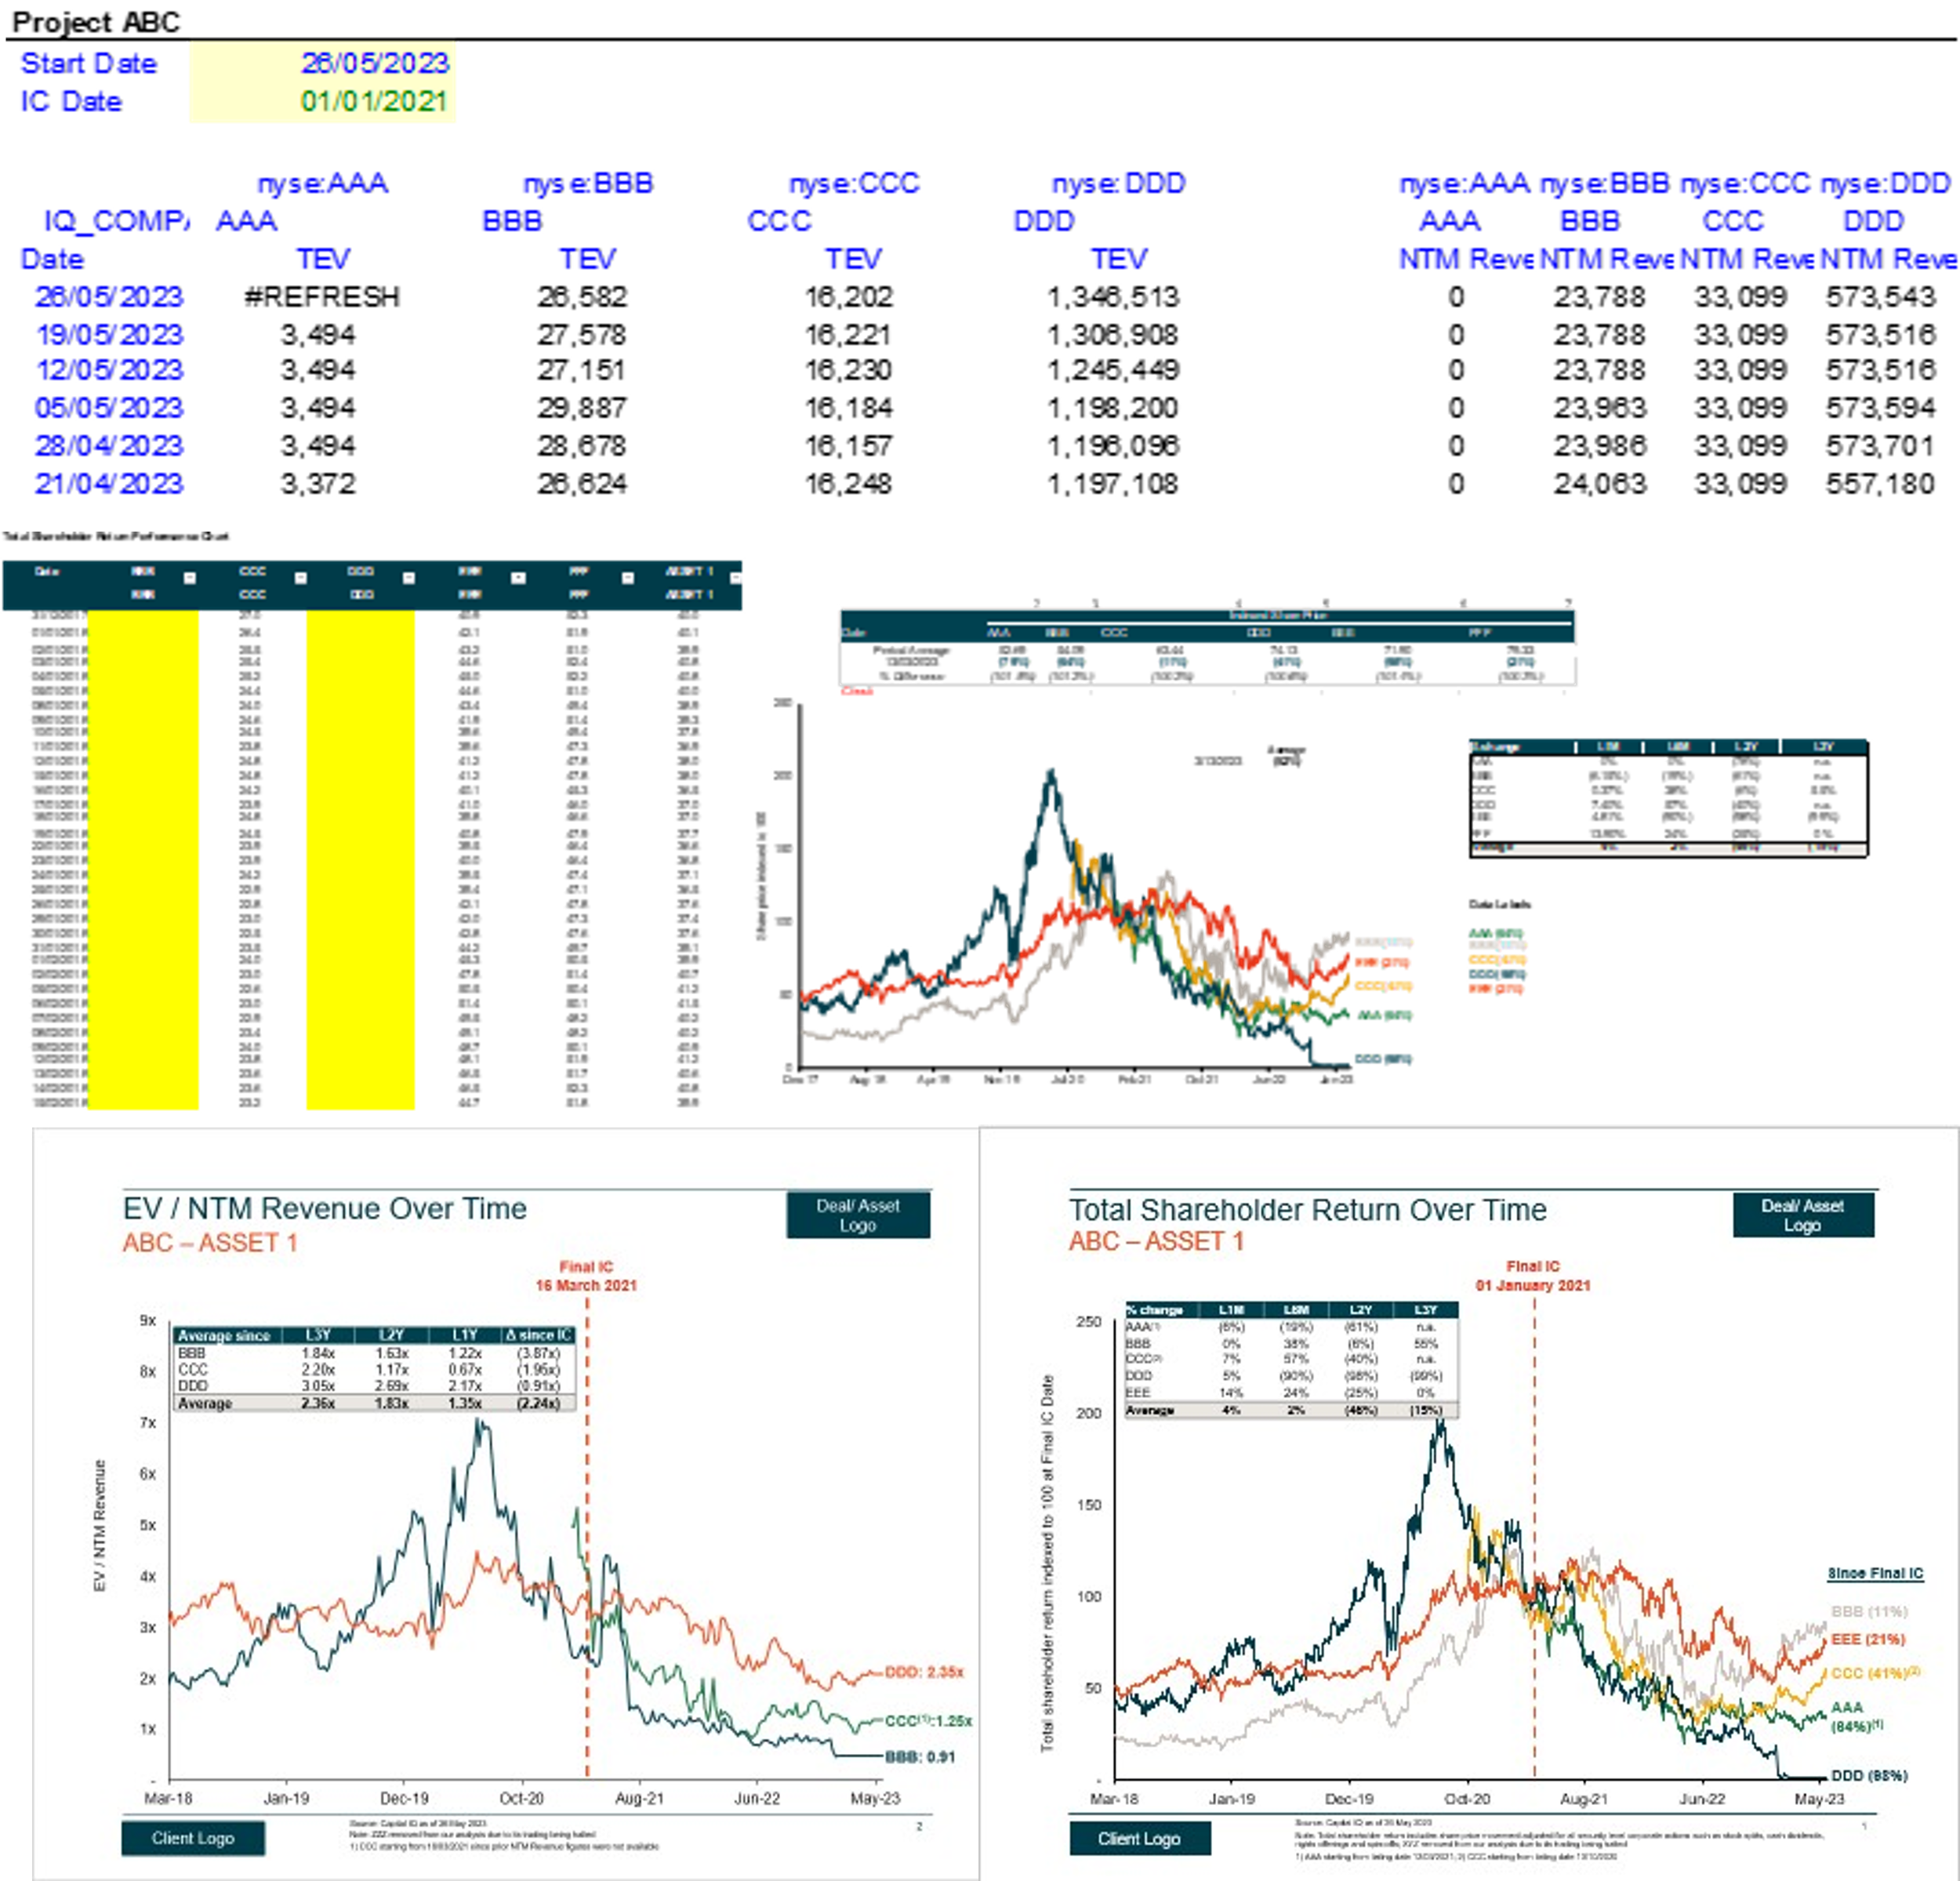
The client, a Private Equity firm, asked the TresVista team to track the Post-Covid valuation of their portfolio companies in comparison to the peers; therefore, provided the team with the list of publicly traded peers for each portfolio company to create a valuation analysis for each portfolio company. The client also wanted the team to create individual sections for each deal along with an initial section for macro-economic factors and pull Total Shareholder Return, TEV, EBITDA, NTM Revenue, Market Indices, Publicly Traded Bond Rate and Fx rates for all the publicly traded peer comparable companies.
To prepare a peer valuation template of all the deals done from the client’s UK office.
The TresVista team followed the following process:
• Valuation Pulls: Pulled valuation related metrics (TEV, Revenue, and EBITDA) in an excel tab as of the Friday of every week
• Market Data Pulls: Pulled market related data from CapIQ (Adjusted Share Price, Market indices, Fx rates, bond rates) on a workday basis
• Values Tab: Value pasted the multiples/market data to avoid having to refresh the pull tab again in case the cache stored data gets removed
• Output Tab: Displayed the charts’ analysis tables (average/% change of L1M, L6M, L1Y, etc.) along with the smoothened valuation multiples
• PPT: Inserted the updated figures into the embedded charts of the ppt, paste the new analysis table and adjust the “Since IC” line to the left
The major hurdles faced by the TresVista team were:
• Preparing consistent templates for all the deals
• Since the pull tab was linked to the CapIQ, the file size was often high due to the large quantum of pull required for few deals. This lead to excel crashes resulting in having to re-pull the figures in multiple iterations
• Creating and updating the deliverable alongside deal execution and other portfolio management deliverables
The team overcame these hurdles by ensuring to have a streamlined template to pull and output the data. The team ensured no format is kept across the empty areas of excel to keep the file size low along with which smaller groups of numbers were refreshed instead of the whole to prevent excel crashes. The team used downtime effectively to update the format and structures of the excels beforehand along with informing the client at the earliest that template would be shared on the next date.

The TresVista team created a streamlined template to help the client’s team to navigate through all the calculations in excel. The team also created analysis tables for the share price, indices and valuation metrics that helped the client to track the performance of their investments over a period along with tracking competitor companies’ delisting/IPO. The team automated the templates that saved time for the client to monitor and quickly update their reforecasts and informed the client in case of any company level activity that drastically affects their valuation metrics.